Spectrogram
Level 2 Category
Definition
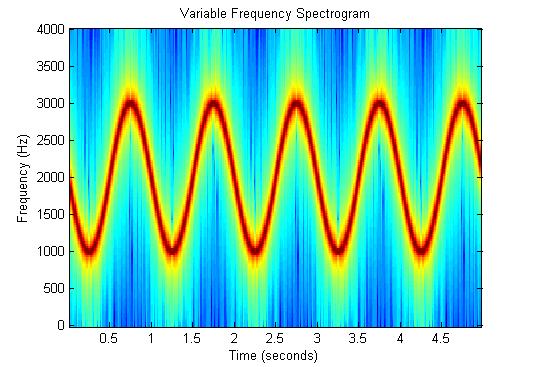
Visual representation of signal frequencies over time, displayed as a heat map with time on x-axis, frequency on y-axis, and color showing amplitude
Example Image