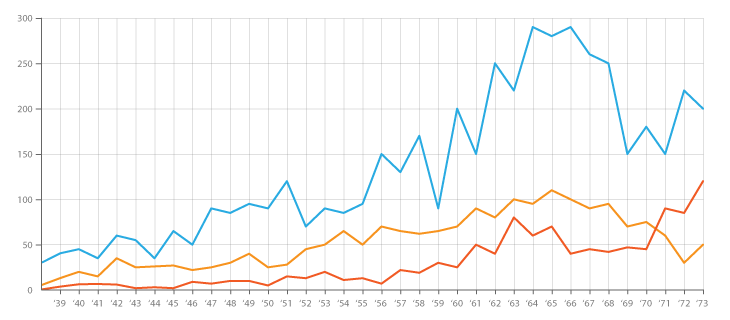
Line chart
Level 2 Category
Definition
Displays data points connected by straight lines, showing trends over time or changes across categories, with the x-axis often representing time
Example Image